In the era of precision farming, it is essential that our field information is not only up-to-date, but also accessible and traceable at any time and from anywhere. Our site analysis app removes these limitations, allowing the users to remotely and continuously check all their fields, even from their mobile phone. All this is made possible by our proprietary app, which is based on Sentinel2 satellite imagery and covers the entire country.
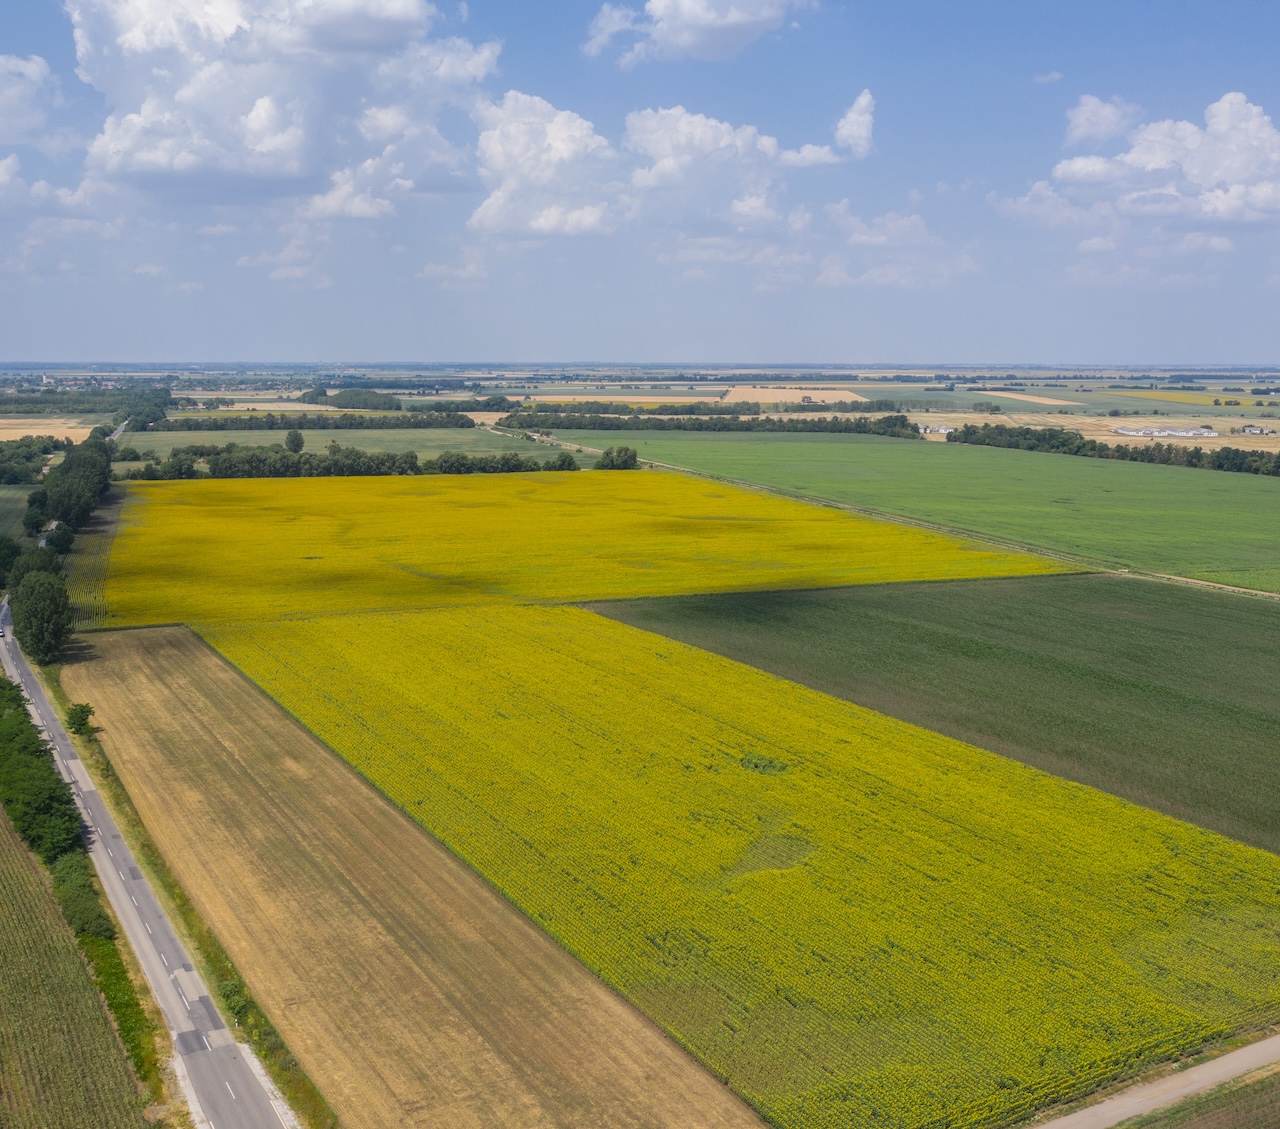
Using satellite data, you can view the current or past vegetation cover of agricultural fields using RGB color images, and also get information on the development or health of the vegetation based on NDVI – Normalized Difference Vegetation Index – maps. The date selector allows you to move backwards in time and track the development of vegetation without having to walk around in the field. A few days after a major weather event (e.g., thunderstorms, hail, etc.), you can see the extent of the damage and where in the field it has occurred. Similarly, we can estimate the spatial extent of wildlife damage, or the damage caused by waterlogging. Moreover, the extent of erosion patches can also be delineated using the app.
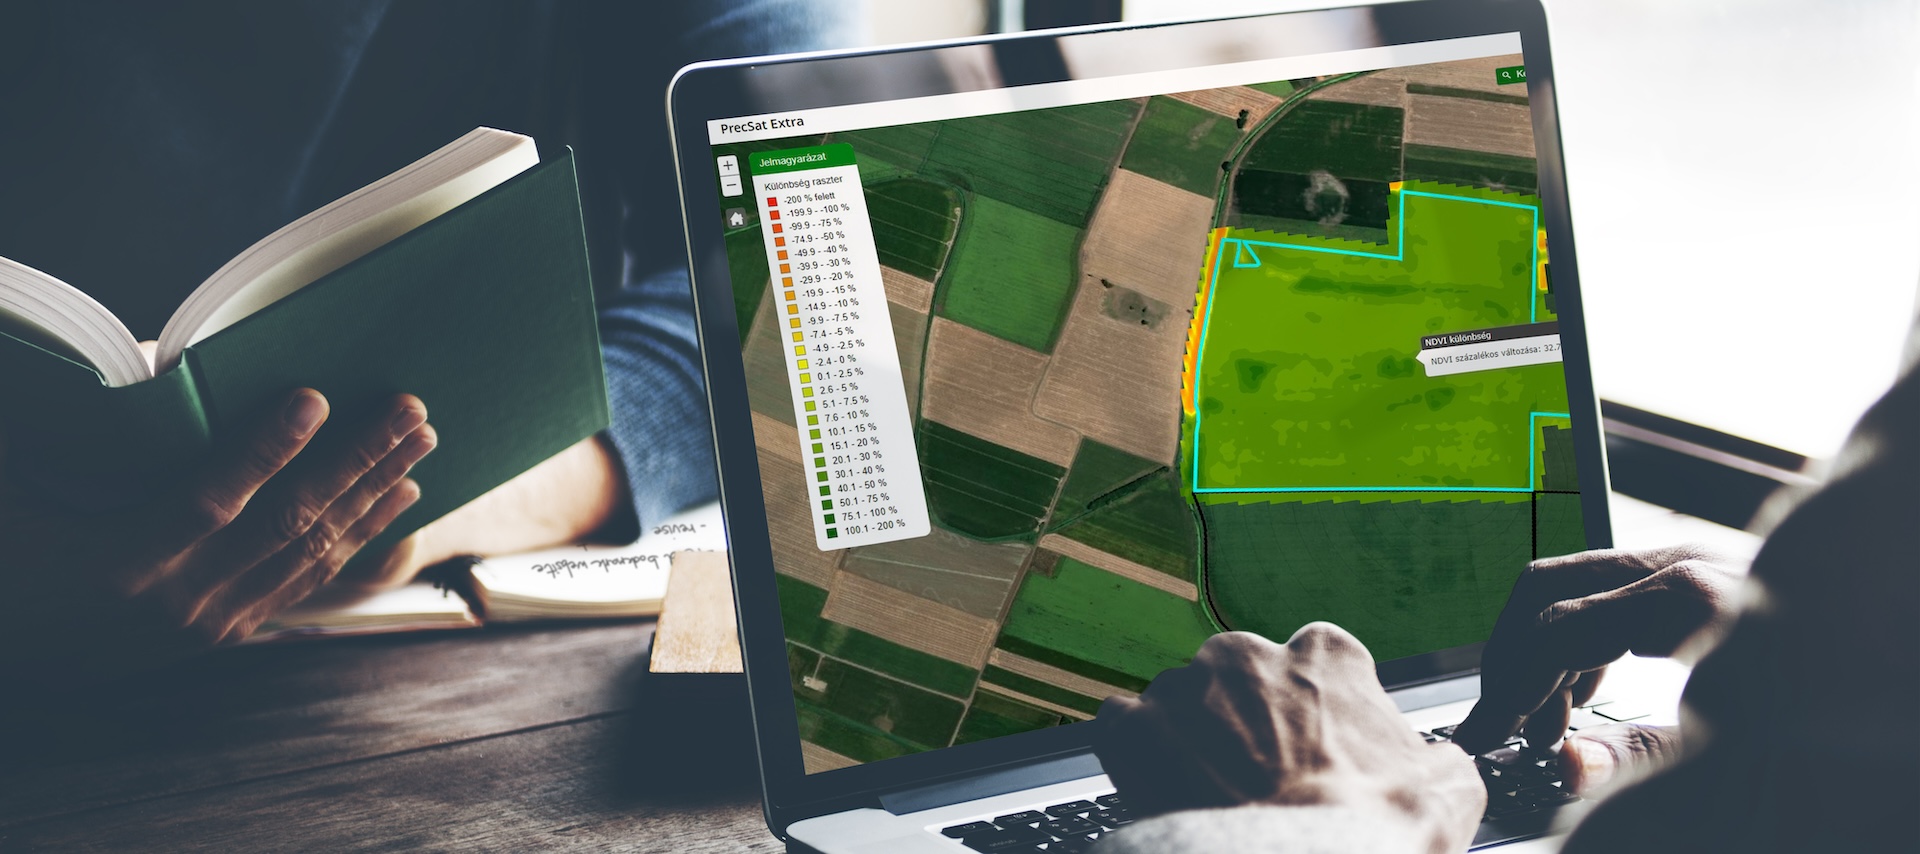
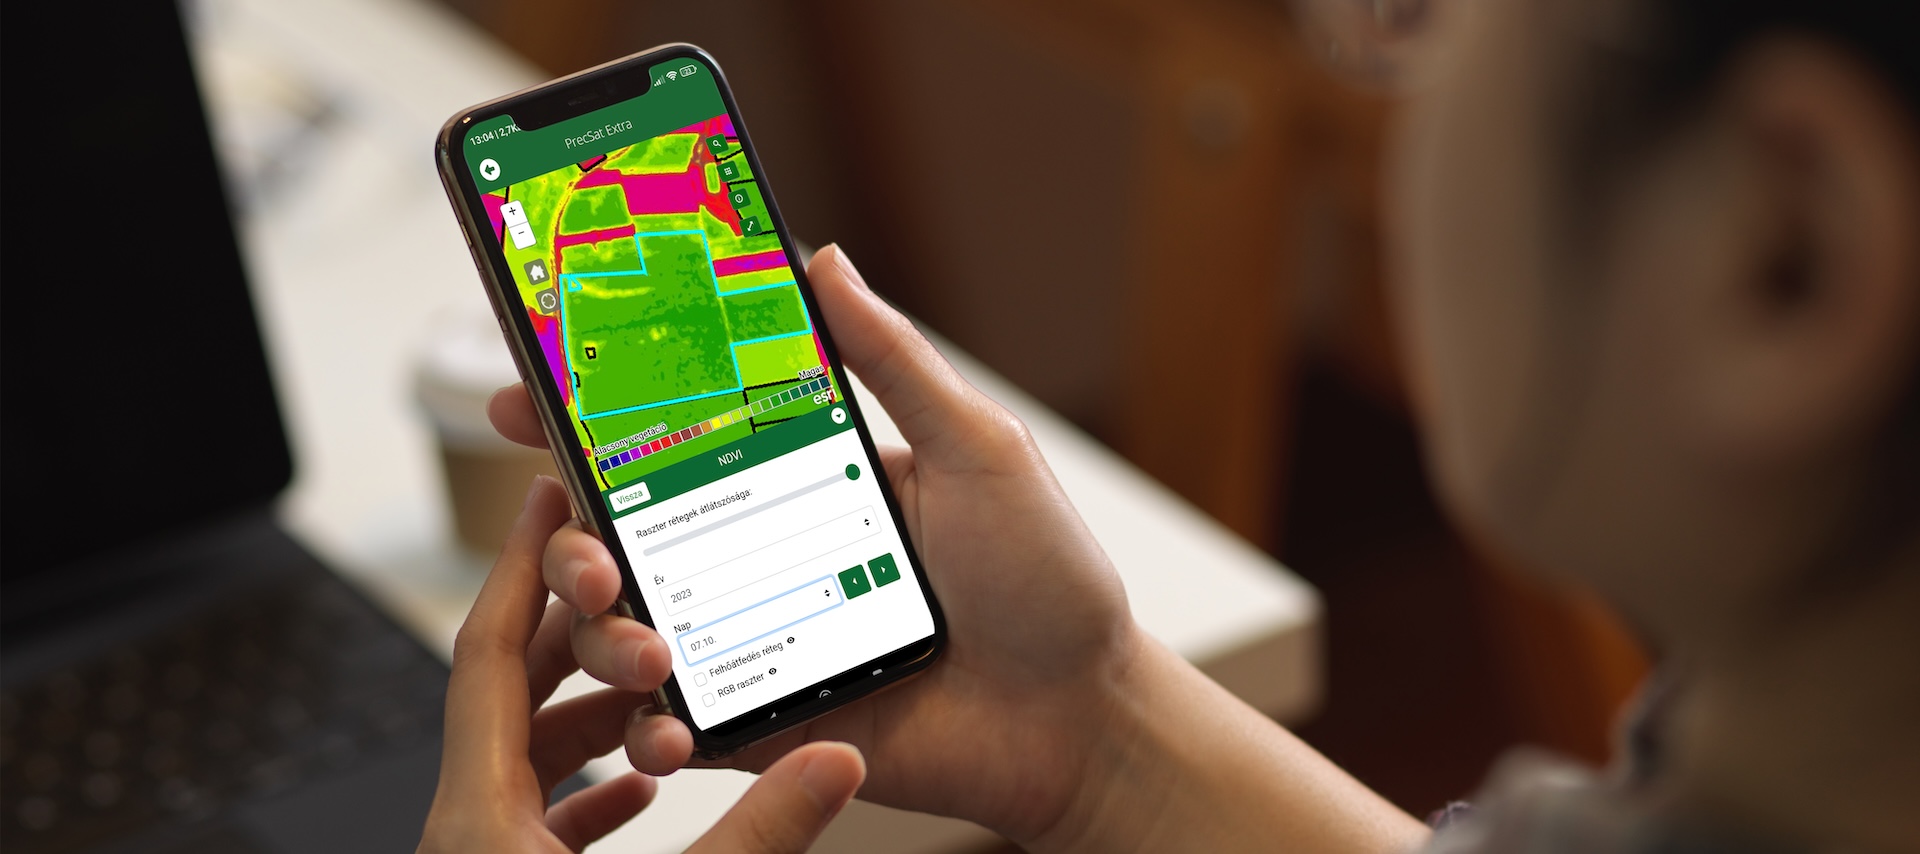
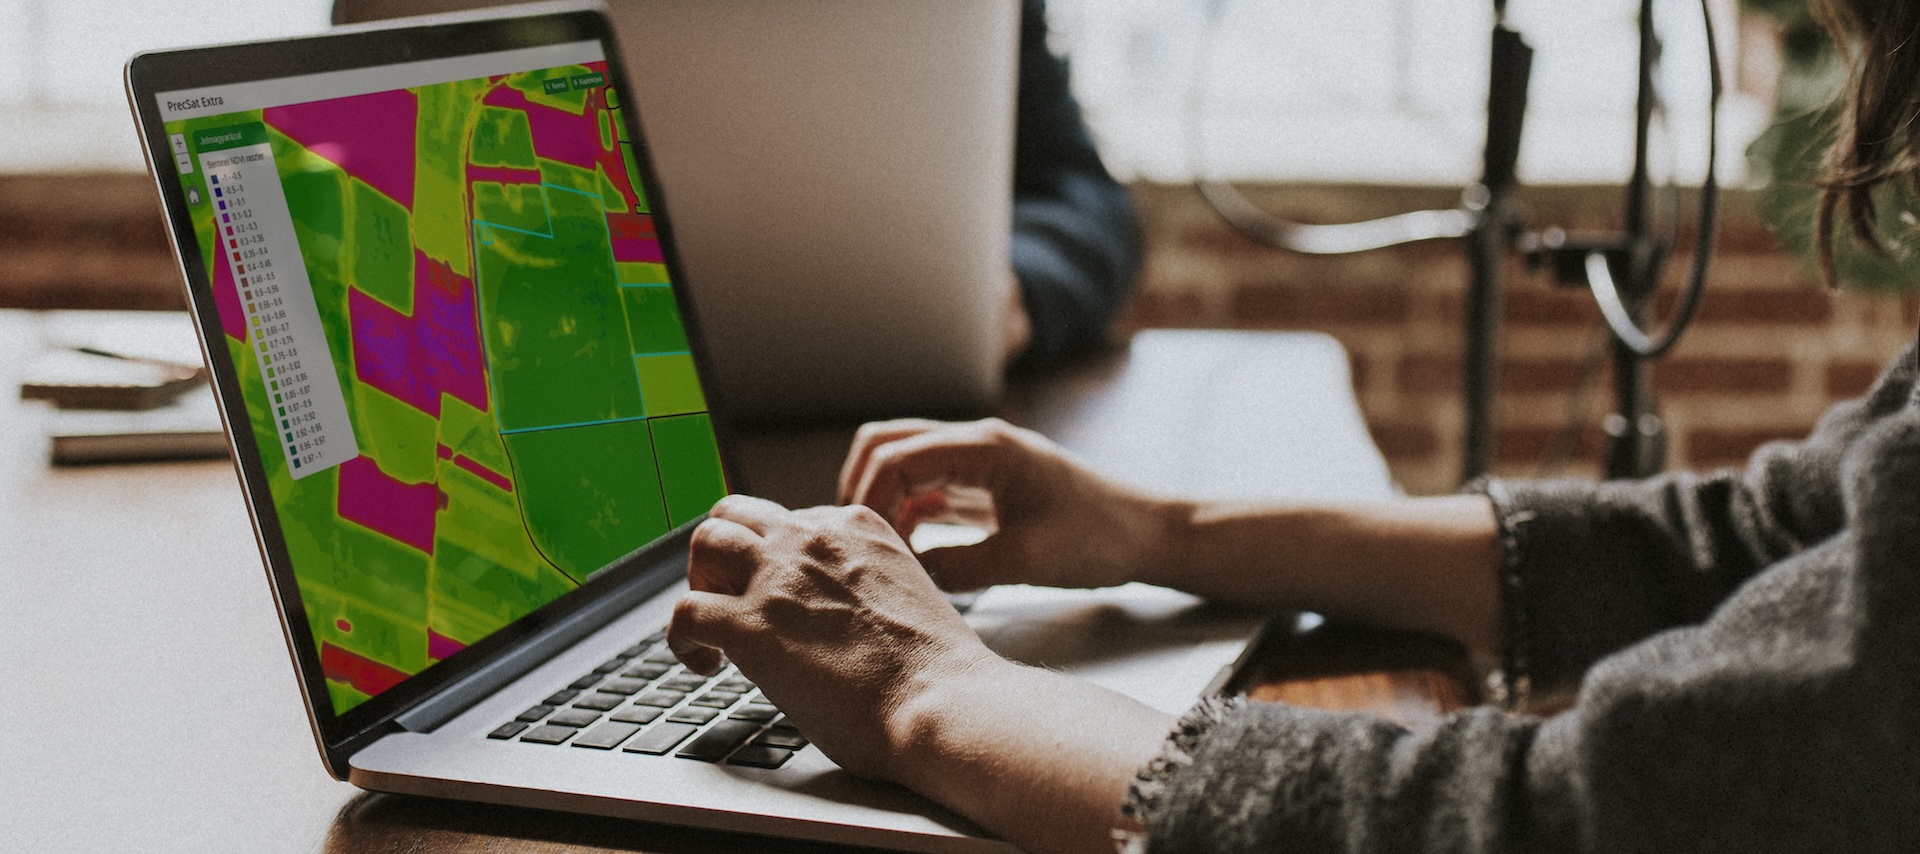
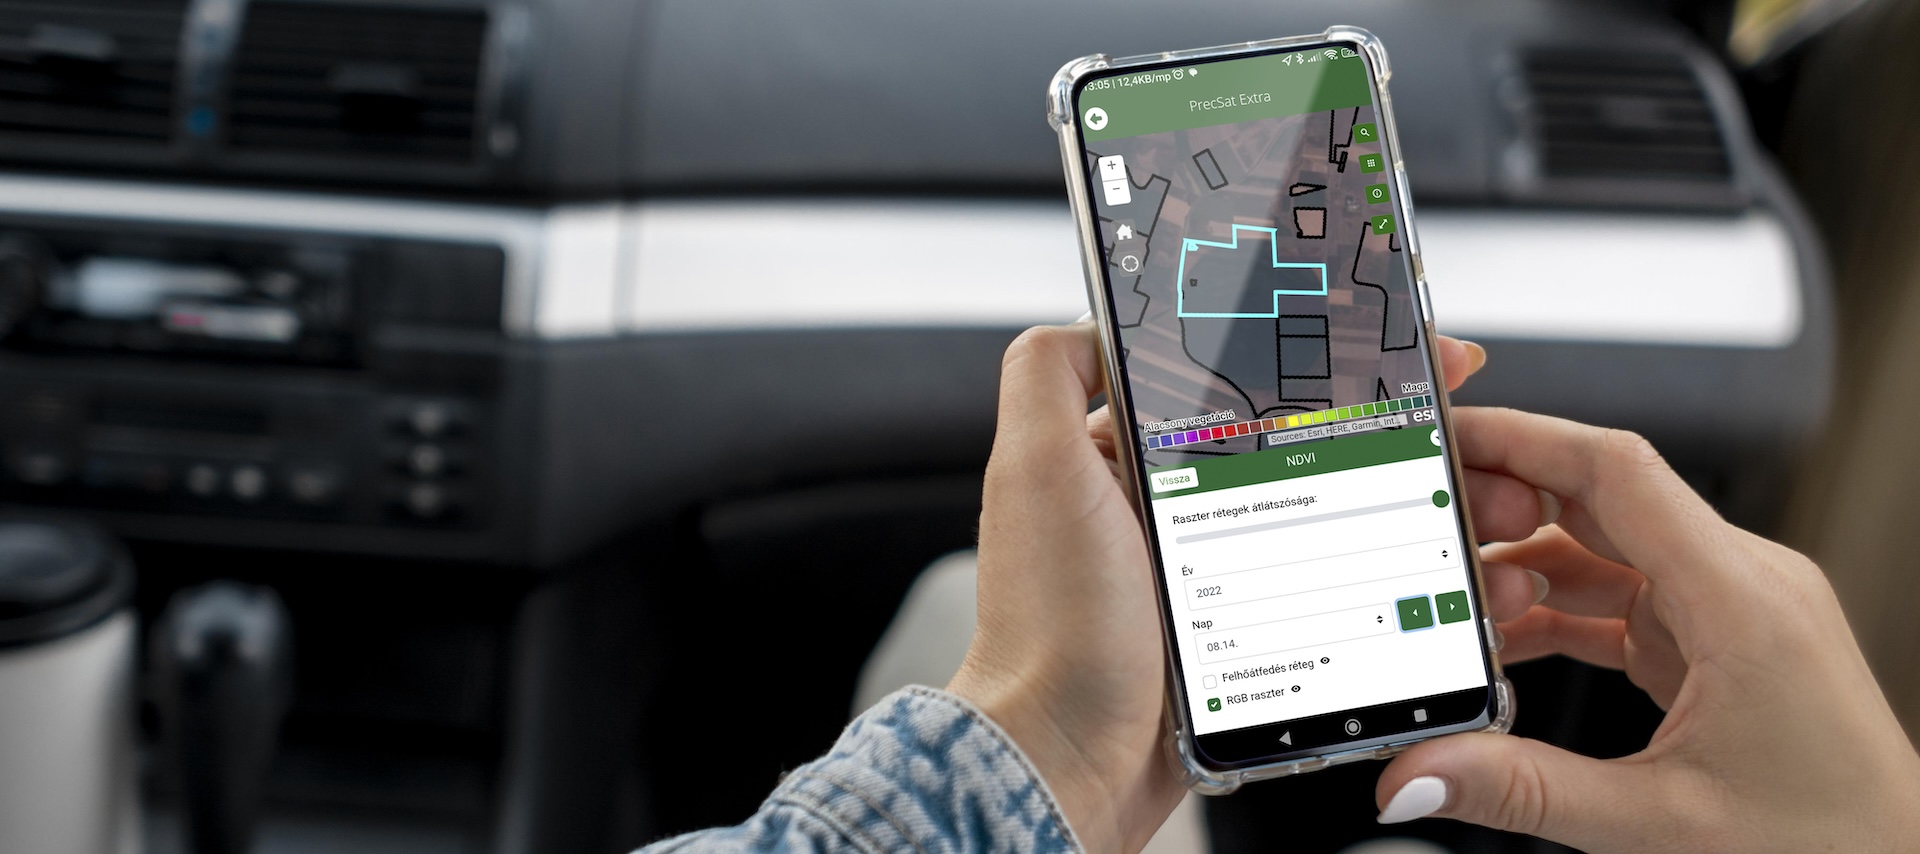
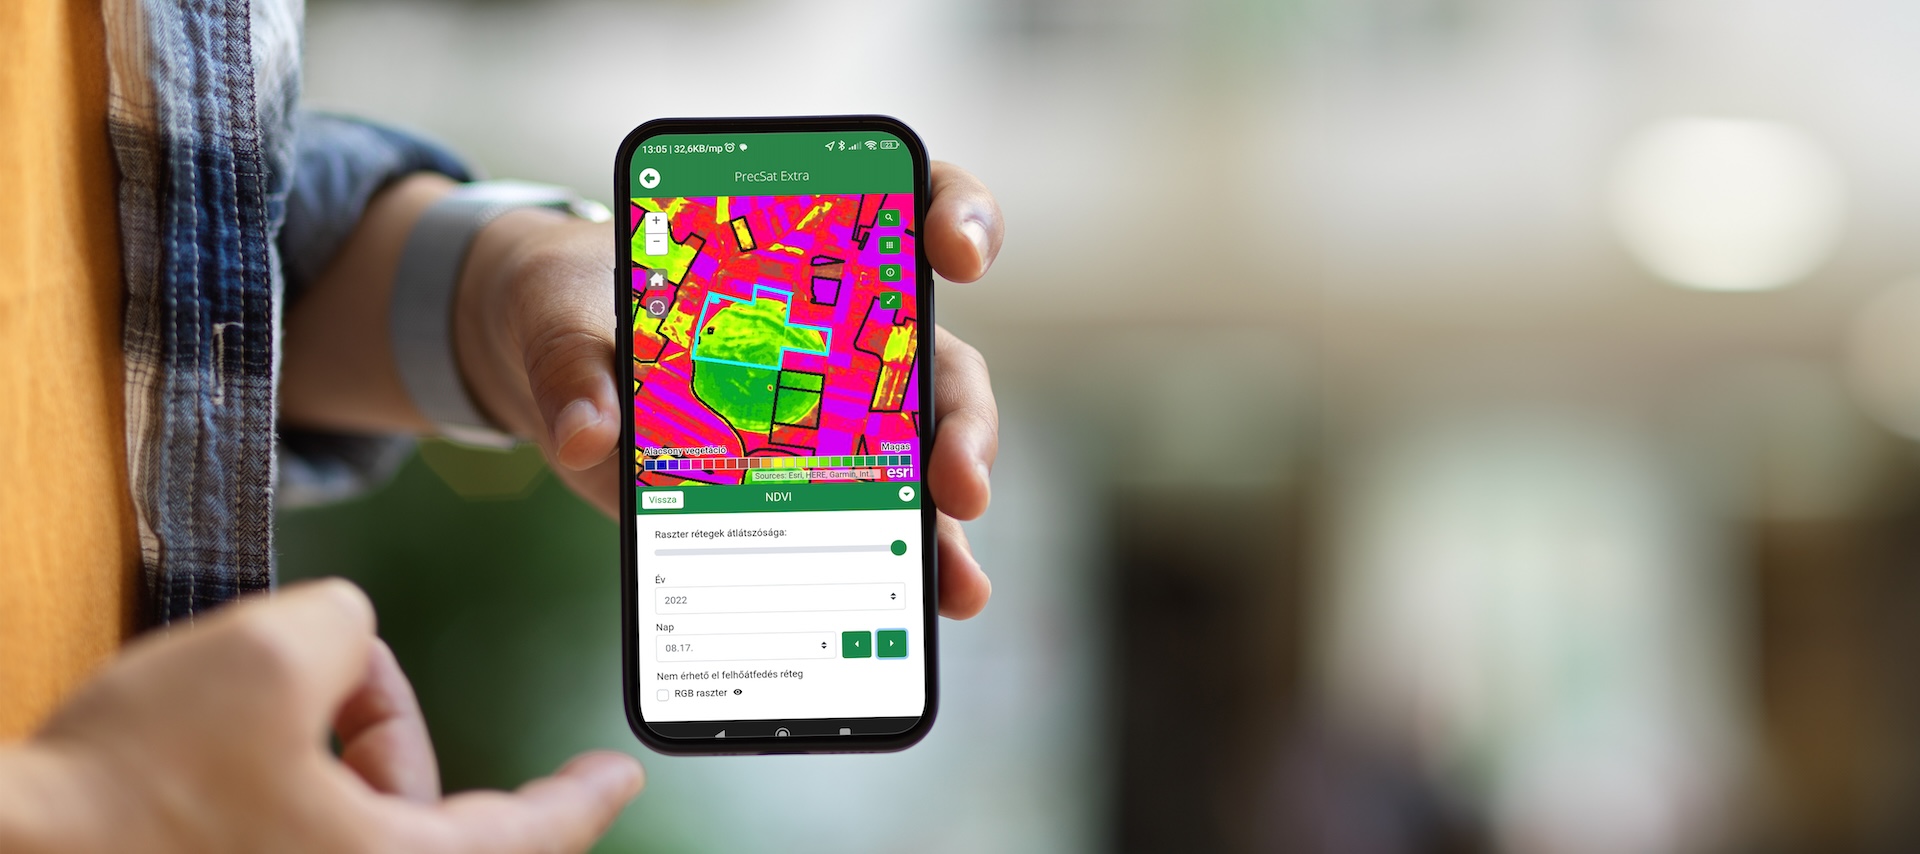
Quantified information on the extent of vegetation development – including historical data – can be retrieved and displayed on a map.
After planting, you can monitor the emergence and development of the crop, the effectiveness of fertilization, and the time and place of damage.
You can spot the difference in any specific part of the field, which means you can head directly to that spot and check the cause of the problem in person.